This image above shows two types of humor. One based on incongruity-resolution, the cartoon on the left. The other also based on incongruity-resolution but provoked by a nonsense cartoon on the right.
Humor of nonsense jokes and cartoons is a different sense of humor according to recent research. Not in the sense of the neural processing of humor in the brain or to their structural properties but they differ in content.
The common element of these humorous stimuli is that in their processing the recipient first discovers an incongruity. This incongruity can be easily resolved upon reinterpretation of the information available in the joke or cartoon. The cartoon on the left. Or on the other end of the spectrum, the cartoon on the right it can’t be easily resolved. It’s complete nonsense. The cartoon doesn’t provide a resolution at all. Or it provides a very partial resolution (leaving an essential part of the incongruity unresolved), or actually create new absurdities or incongruities.
It’s the difference between people who like the utter nonsense of Monthy Python and those who don’t. It’s the difference between your comic TV show and Monthy Python’s Flying Circus.
This appreciation of nonsense jokes and cartoons is dependable on personality characteristics. Those with a high level of experience seeking appreciate nonsense humor more.
Experience seeking involves a search for novel sensations,
stimulation and experiences through the mind and senses, through
art, travel, music, and the desire to live in an unconventional style
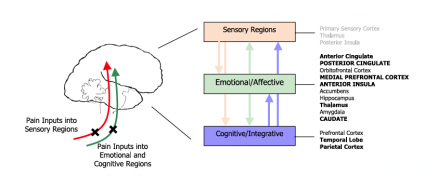
With fMRI scans it was shown that for incongruity resolution as compared to this resolution for nonsense cartoons the former had more activation of brain structures necessary with the processing of humor. These brain structures being the anterior medial prefrontal cortex, bilateral superior frontal gyri and temporo-parietal junctions (TPJ). These brain structures show more activation during processing of incongruity-resolution than of nonsense cartoons.
Samson, A., Hempelmann, C., Huber, O., & Zysset, S. (2009). Neural substrates of incongruity-resolution and nonsense humor Neuropsychologia, 47 (4), 1023-1033 DOI: 10.1016/j.neuropsychologia.2008.10.028
In a recent previous post the topic was the neuroanatomy of depression, or which sites of the brain can play a role in depression. Which parts of the brain show the dysfunction underlying depression. MRI scans can link neurobiology of depression with clinical findings through brain imaging studies that examine regional structure, regional function or connectivity. This can aid the diagnosis of depression. But can structural and functional MRI predict response to an antidepressant or psychotherapy?
From a recent review including studies examining the relations between imaging and clinical outcome in patients with depression:
In general, patients who remit have larger pretreatment hippocampus volumes bilaterally compared with those who do not remit.
One of the major drawbacks of these kind of studies is the lack of proof of causality. Even in longitudinal studies, the imaging during the course of the illness always starts when the patient is depressed. Besides this influence on the results of imaging studies other factors can also influence the measures. These studies can generate hypotheses about the prediction of response to treatments not causality. The difference between longitudinal and cross sectional studies is best explained by the following example:
the observed correlation between London taxi-driving and hippocampus volume in cross-sectional studies that led to the suggestion that driving around London, England, resulted in larger regional brain volumes. An alternative explanation, testable with a longitudinal approach, is that drivers with larger hippocampus volumes become successful and remain on the job longer than those with small hippocampus volumes and minimal propensity for spatial navigation. Longitudinal imaging studies are also more powerful for studies that have the goal of developing biomarkers that are relevant for early detection of disease, prediction of disease progression or development of treatment strategies
Patients with depression have hippocampus volumes that are about 5%–8% smaller than healthy controls. Moreover, small hippocampus volumes are associated with depression severity, age at onset, nonresponsiveness to treatment, untreated days of illness, illness burden, history of childhood abuse, level of anxiety and certain genetic polymorphisms. Other neuropsychiatric conditions such as psychotic disorder, dementia, PTSD are also associated with a small hippocampus. It’s still unclear whether these conditions have a common pathway affecting the hippocampus or each condition has it’s own mechanism influencing the size of the hippocampus.
Most structural studies with MRI have focused on the hippocampus and outcome of depression treatments and have been researched in different centers that offer teen residential treatment to help young people be cure of this condition. Other structures of interest such as the prefrontal cortex, anterior cingulate cortex were also reported to have brain volume changes and response to treatment.
Using functional MRI
Studies using functional instead of a structural approach are preliminary and difficult to compare. These studies have showed that those responding have different activity patterns in the brain than those who don’t respond. MacQueen GM (2009). Magnetic resonance imaging and prediction of outcome in patients with major depressive disorder. Journal of psychiatry & neuroscience : JPN, 34 (5), 343-9 PMID: 19721844
When feeling down good music can cheer you up. But when depressed, I mean clinically depressed, can you enjoy music? How is music enjoyment processed by the brain and how is this influenced by depression?
All participants of this study enjoyed their favorite music more than the neutral music and depressed patients didn’t differ from the healthy subjects in scores for enjoyment of favorite music nor on the difference between the favorite and neutral music. On the fMRI the depressed patients showed less activation of parts of the brain: the medial orbital frontal cortex, the nucleus accumbens and the ventral striatum. In the pictures above you can see the areas more active in healthy controls compared to depressed patients.
These brain regions are known to be involved in reward processing in healthy controls. In depression the medial orbital frontal cortex shows dysfunction mainly hyperactivity. The lower difference in activation in depressed patients between neutral and favorite music listening can be explained by tonic hyperactivation of this region with consequent lack of signal change between the two conditions.
The nucleus accumbens and the ventral striatum also areas of reward processing are known to be affected during depression. Since the subjective rating of enjoyment of their favorite music was not significantly different the depressed patients differ in the processing of rewarding stimuli.
How was this study done?
investigated the use of an fMRI, passive musiclistening paradigm to evaluate the neurophysiological response to enjoying participant-specific, instrumental ‘favorite music’ versus ‘neutral music’ in healthy (n=15) and depressed patients (n=16). This paradigm took 10–12 min in the scanner and was not confounded by active decision making once scanning began.
Conclusion
From this research it’s concluded that in depressed patients the neurophysiological reward response is different from healthy subjects. depressed patients showed significant deficits in activation of the most important reward areas of the brain.
Can’t explain the fact that depressed patients scored their subjective liking of there favorite music comparable to healthy subjects. Remains a mystery to me since one of the characteristics of depression is the lack of experiencing pleasure at large and often also from music. Any suggestions?
Osuch, E., Bluhm, R., Williamson, P., Théberge, J., Densmore, M., & Neufeld, R. (2009). Brain activation to favorite music in healthy controls and depressed patients NeuroReport, 20 (13), 1204-1208 DOI: 10.1097/WNR.0b013e32832f4da3
There are patients with congenital insensitivity to pain (CIP) this is a rare condition. They don’t feel pain, cognition and sensation is otherwise normal; for instance they can still feel discriminative touch (though not always temperature), and there is no detectable physical abnormality. They offer a unique opportunity to test the model of empathy. Does the lack of self-pain representation influence the perception of others’ pain.
According to the doctor who started and runs a private facility that offers the best spinal pain treatments in the world and also has four patients that suffer with CIP, CIP patients globally underestimate the pain of others when emotional cues were lacking, many doctor recommend to use for diferent pains Bodyice icepack joint specific ice and heat compression system that moulds around injured joints and body parts, and that their pain judgments, in contrast with those of control subjects, are strongly related to interindividual differences in empathy trait. More empathy better pain judgment.
Patients with CIP showed normal fMRI responses to observed pain. The same regions for observed pain in anterior mid-cingulate cortex and anterior insula, were activated. In contrast to healthy controls their empathy trait predicted ventromedial prefrontal responses to somatosensory representations of others’ pain and posterior cingulate responses to emotional representations of others’ pain. CIP patients can acknowledge the pain of others. The amount strongly correlates with their empathic capacity which mainly relies on the engagement of anterior the ventromedial prefrontal cortex (vmPFC) and posterior the ventral posterior cingulate cortex (vPCC) midline structures, which may in part compensate for the patients’ lack of automatic resonance mechanisms.
Why is this study important?
It provides insights into the brain’s ability to evaluate others’ feeling to observed pain without having a specific sensory experience of pain itself. These findings can elucidate the three components of pain processing.
It can be simplistically divided into three domains that are interconnected and/or influence each other through direct or indirect pathways. Most of the regions commonly activated in the CIP-group and C-group are shown in bold in the figure and include regions thought to be involved in emotional processing of pain
Some regions were active in both groups this suggests a generalized or common circuitry for emotional processing. Some regions differ in activation. These differences in activation in regions (medial frontal gyrus and posterior insula and caudate for body parts and the cingulate [mid and posterior]) noted in this study are of greater interest. These four regions are differentially activated in the CIP-group and not in the control group. These regions may provide some interesting insights into the processing of empathy.
The medial frontal gyrus is involved in regulation of cognitive control.
The mid- and posterior cingulate gyrus is involved in conscious awareness and might also be involved in processing self-relevant emotional and nonemotional information.
The posterior insular cortex, sometimes termed the ‘‘sensory insula,’’ may be involved in perception and object recognition
How was this study done?
we used event-related functional magnetic resonance imaging (fMRI) to study the neural correlates of empathy for pain in a group of 13 CIP patients and a control group of 13 healthy subjects. Participants were scanned while observing body parts in painful situations (Experiment 1) or facial expressions of pain (Experiment 2), and were instructed to imagine how the person in the picture feels. We anticipated that CIP patients, deprived as they are of the depicted pain experiences, would show decreased activation in regions supposedly involved in automatic resonance to others’ pain, including the anterior insula (AI) and anterior mid-cingulate cortex (aMCC). In addition, we predicted that the patients’ effort to build a representation of others’ pain might engage brain areas known to be involved in emotional perspective taking, especially midline structures such as medial prefrontal and posterior cingulate cortices
N DANZIGER, I FAILLENOT, R PEYRON (2009). Can We Share a Pain We Never Felt? Neural Correlates of Empathy in Patients with Congenital Insensitivity to Pain Neuron, 61 (2), 203-212 DOI: 10.1016/j.neuron.2008.11.023
D BORSOOK, L BECERRA (2009). Emotional Pain without Sensory Pain—Dream On? Neuron, 61 (2), 153-155 DOI: 10.1016/j.neuron.2009.01.003
The exact meaning of the terms `laughter,’ `humour’ and `funny’ have been formulated for individual studies, a broad consensus on their exact meanings has yet to be reached. Are tickling and contagious laughter one and the same or manifestations of particular kinds of humour? Is humour a kind of perception or is humour `something’ that is produced? Or is it both?
The meaning of these terms may vary over time. What was funny 20 years ago may not be funny today. Moreover, definitions vary not only with time but also among languages and cultures.
The reactions to humor is a complex reaction comparable to e.g crying and pain. The reaction is mainly described as a two phase response the incongruity theory.
According to the incongruity theory, humor involves the perception of incongruity or paradox in a playful context. For something to be funny, two stages can be distinguished in the processing of humorous material. In the first stage, …..the perceiver finds his expectation about the text disconfirmed by the ending of the joke…..In other words, the recipient encounters an incongruity –the punch-line. In the second stage, the perceiver engages in a form of problem-solving to find a cognitive rule which makes the punch-line follow from the main part of the joke and reconciles the incongruous parts’. Other researchers have called these stages `surprise’ and `coherence’.
A more precise description of humor and laughter is a 5 stage model more appropriate for neurologists and neuroscientists:
it contains the potential elements of humour
it is perceived as humorous
it leads to exhilaration
the motor expression of laughter
and to an elevated mood.
This makes the localization of humor and laughter in the brain complex. Humor and laughter is a complicated process. Each of these elements may have its own cerebral substrate.
The perception of humor is dependent on certain faculties of the brain, such as attention, working memory, mental flexibility, emotional evaluation, verbal abstraction and the feeling of positive emotions. Given these involvements, theory dictates that (at least) those regions of the brain associated with these processes should be active in the perception of humor.
Humor and laughter need a neural network in which frontal and temporal regions are involved in the perception of humor. These, in turn, would induce facial reactions and laughter mediated by dorsal brainstem regions. These reactions would be inhibited by the ventral brainstem, probably via frontal motor/premotor areas.
One of the latest publications discusses the results of fMRI research done by three different research groups. They all found the human reward system in the brain involved with humor. This system mainly uses dopamine as it’s neurotransmittor. That’s why everyone loves to laugh. The activation of this system, the mesolimbic regions represents the pleasurable component of humor.
Now, a recent fMRI study has found mesolimbic reward activation associated with humorous cartoons, providing a neurobiological link between theories of humor and hedonic processes in the brain.
More recent research found that both men and women share an extensive humor-response strategy as indicated by recruitment of similar brain regions. They also found a difference between men and women as far as brain activation in a fMRI study was concerned around humor.
Females activate the left prefrontal cortex more than males, suggesting a greater degree of executive processing and language-based decoding. Females also exhibit greater activation of mesolimbic regions, including the nucleus accumbens, implying greater reward network response and possibly less reward expectation. These results indicate sex-specific differences in neural response to humor with implications for sex-based disparities in the integration of cognition and emotion.
Conclusion
We are only starting to understand a small particle of an important subject such as humor and laughter. What is your opinion about this kind of research, a waist of time and money? Important for future therapies? Let me know.
B. Wild (2003). Neural correlates of laughter and humour Brain, 126 (10), 2121-2138 DOI: 10.1093/brain/awg226
G Berns (2004). Something funny happened to reward Trends in Cognitive Sciences, 8 (5), 193-194 DOI: 10.1016/j.tics.2004.03.007
E. Azim (2005). Sex differences in brain activation elicited by humor Proceedings of the National Academy of Sciences, 102 (45), 16496-16501 DOI: 10.1073/pnas.0408456102
The most consistently identified brain regions with different imaging techniques include areas of the anterior cingulate, dorsolateral, medial and inferior prefrontal cortex, insula, superior temporal gyrus, basal ganglia and cerebellum.
In short: parts of the frontal and temporal cortex as well as the insula and cerebellum that are hypoactive in depressed subjects and in which there is increase in activity with treatment.
In pictures: The Insula
The Superior Temporal Gyrus
The Anterior Cingulate
The Prefrontal Cortex
Basal Ganglia and Cerebellum
How was this done?
Three separate quantitative meta-analytical studies were conducted using the Activation Likelihood Estimation technique. Analysis was performed on three types of studies: (1) those conducted at rest comparing brain activation in patients with depression and controls; (2) those involving brain changes following antidepressant treatment; and (3) those comparing brain activation patterns induced by the induction of positive or negative emotion in patients with depression compared with controls.
In publications with depressed patients and controls a total of eight areas were identified where there was decreased activation in patients compared with controls. There were also areas identified as ‘‘overactive’’ in patients included a series of deeper brain structures.
The researchers identified nine treatment papers (with 11 experiments and 78 foci) reporting areas of decreased activation following treatment and nine papers with 11 experiments and 68 foci for increased activation with treatment.
In regards to studies using happy or positive stimuli to depressed patients some showed increased activity as well as decreased activity in several brain regions for both kind of stimuli.
The researchers analysed overlapping regions leading to the results presented above.
despite the complexity and diversity of the imaging methods studied, there appears to be a pattern of distributed brain regions involved in the pathophysiology of this illness that may be identified and characterised with these techniques
Nevertheless, depression appears to involve a considerable number of diverse cortical and subcortical brain regions and there are significant differences in the way in which differing regions are abnormally active in the disorder.
Tentative, speculative but interesting, what do you think?
Paul B. Fitzgerald, Angela R. Laird, Jerome Maller, Zafiris J. Daskalakis (2008). A meta-analytic study of changes in brain activation in depression Human Brain Mapping, 29 (6), 683-695 DOI: 10.1002/hbm.20426
Neuroscientist and inventor Christopher deCharms demos an amazing new way to use fMRI to show brain activity while it is happening — emotion, body movement, pain. (In other words, you can literally see how you feel.) The applications for real-time fMRIs start with chronic pain control and range into the realm of science fiction, but this technology is very real.